After the introduction of the SMU ADALM1000 lets continue with the 12th part in the series with some small, basic measurements.
Written by Doug Mercer and Antoniu Miclaus, Analog Devices
The objective of this lab activity is to: 1) Construct a band-pass filter by cascading a low-pass filter and a high-pass filter, and 2) Obtain the frequency response of the filter and learn how to use the Bode plotter software.
Background:
A band-pass filter allows for a specific range of frequencies to pass, while blocking or attenuating lower and higher frequencies. It passes frequencies between the two cut off frequencies while attenuating frequencies outside the cut off frequencies.
One typical application of a band-pass filter is in audio signal processing, where a specific range of frequencies of sound are desired while attenuating the rest. Another application is in the selection of a specific signal from a range of signals in communication systems.
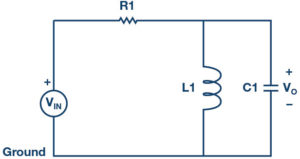
A band-pass filter may be constructed by cascading a high-pass RL filter with a roll-off frequency fL and a low-pass RC filter with a roll-off frequency fH, such that:
The lower cut off frequency is given as:
The higher cut off frequency is given as:
The bandwidth of frequencies passed is given by:
All the frequencies below fL and above fH are attenuated and the frequencies between are passed by the filter.
From the previous lab on parallel LC resonance, we can also use the formula for the LC resonance to calculate the centre frequency of the band-pass filter. The resonant frequency ωo is given by:
or
Frequency response
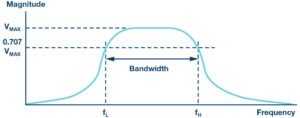
To show how a circuit responds to a range of frequencies, a plot of the magnitude (amplitude) of the output voltage of the filter as a function of the frequency can be drawn. It is generally used to characterize the range of frequencies in which the filter is designed to operate within. Figure 3 shows a typical frequency response of a band-pass filter.
Materials:
- ADALM1000 hardware module
- Resistors (1.0kΩ)
- Capacitors (0.047µF)
- Inductors (20mH)
Procedure:
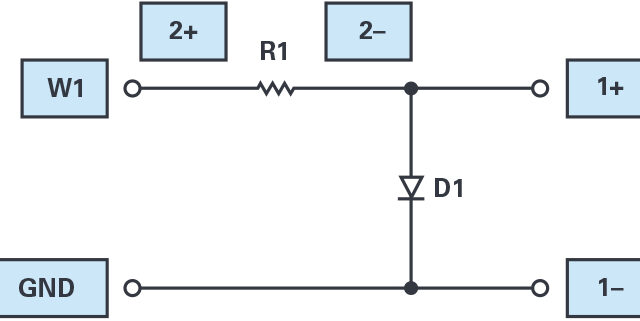
- Set up the filter circuit as shown in Figure 2 on your solderless breadboard, with the component values R1 = 1kΩ, C1 = 0.047µF, L1 = 20mH.
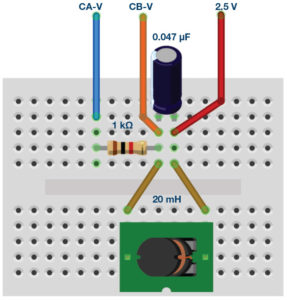
- Set the Channel A AWG Min value to 0.5 and Max value to 4.5V to apply a 4V p-p sine wave centred on 2.5V as the input voltage to the circuit. From the AWG A Mode drop-down menu, select SVMI mode. From the AWG A Shape dropdown menu, select Sine. From the AWG B Mode dropdown menu, select Hi-Z mode.
- From the ALICE Curves drop-down menu, select CA-V and CB-V for display. From the Trigger drop-down menu, select CA-V and Auto Level. Set the Hold Off to 2msec. Adjust the time base until you have approximately two cycles of the sine wave on the display grid. From the Meas CA dropdown menu, select P-P under CA-V and do the same for CB. Also, from the Meas CA menu, select A-B Phase.
- Start with a low frequency—we’ll use 100Hz for our example – and measure the output voltage CB-V peak to peak from the scope screen. It should be much lower than the Channel A output. Increase the frequency of Channel A in small increments until the peak-to-peak voltage of Channel B is roughly 0.7 times the peak-to-peak voltage of Channel A. Compute 70% of V p-p and obtain the frequency at which this happens on the oscilloscope. This gives the cut off (roll-off) frequency for the constructed high-pass RL section of the filter.
- Continue increasing the frequency of Channel A until the peak-to-peak voltage of Channel B falls back to roughly 0.7 times the peak-to-peak voltage of Channel A. Compute the frequency at which this happens on the oscilloscope. This gives the cut off (roll-off) frequency for the constructed low-pass RC section of the filter. Note that this 70% amplitude point occurs twice on the band-pass filter: at the lower cut off and upper cut off frequencies.
Frequency response plots with the ALICE Bode Plotter
The ALICE Desktop software can display Bode plots, which are graphs of the magnitude and the phase vs. the frequency of a given network. The procedure is as follows:
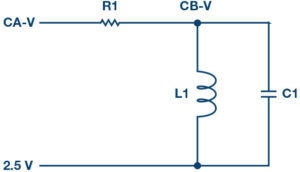
Use the band-pass circuit in Figure 2. By having R1 = 1.0kΩ, C1 = 0.047µF, and L1 = 20mH, we can sweep the input frequency from 500Hz to 12,000 Hz and plot the signal amplitude of both Channel A and B and the relative phase angle between Channel B and A.
With the circuit connected to the ALM1000, as in Figure 2, start the ALICE Desktop software. Open the Bode plotter.
Under the Mode dropdown menu, select Peak Hold mode. Under the FFT window menu, select Flat Top Window. Click the + Samples button until 4,096 samples are selected. Under the Curves menu, select CA-dBV, CB-dBV, and Phase B-A.
Under the Options dropdown menu, click on Cut-DC.
Set the AWG Channel A Min value to 1.086 and the Max value to 3.914. This will be a 1V rms (0dBV) amplitude centred on the 2.5V middle of the analogue input range. Set the AWG A mode to SVMI and Shape to Sine. Set AWG Channel B to Hi-Z mode. Be sure the Sync AWG check box is selected.
Use the Start Frequency button to set the frequency sweep to start at 500Hz and use the Stop Frequency button to the sweep to stop at 12,000Hz. Select CHA as the channel to sweep. Also use the Sweep Steps button to enter the number of frequency steps, using 700 as the number.
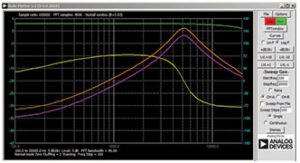
You should now be able to press the green Run button and run the frequency sweep. After the sweep is completed (this could take several minutes for 700 points), you should see something like the screenshot in Figure 6. You may want to use the LVL and dB/div buttons to optimize the plots to best fit the screen grid.
Record the results and save the Bode plot using a screen capture tool and include it in your lab report.
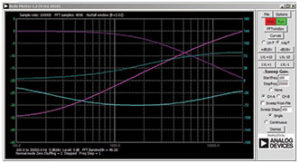
To better understand the frequency characteristics of this parallel LC filter plot the low-pass frequency response with just the capacitor (that is, remove the inductor). Make the same frequency sweep and take a snapshot of the gain (CB-db – CA-dB) and relative phase (CA – CB). Now plot the high-pass frequency response with just the inductor (that is, put the inductor back and remove the capacitor). The Bode plot in Figure 7 shows these results. Note that the frequency where the low-pass and high-pass gain is the same and the relative phase sums to zero (at about +70° and –70°) is at the resonant frequency.
Questions
- Compute the cut off frequencies for each band-pass filter constructed using the formula in Equation 1 and Equation 2. Compare these theoretical values to the ones obtained from the experiment and provide suitable explanation for any differences.
Notes
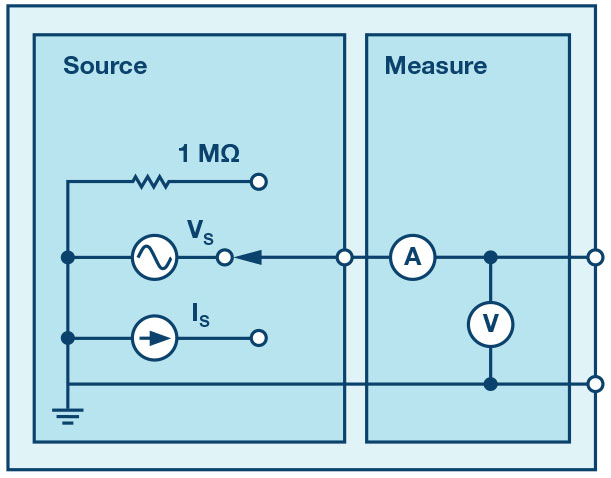
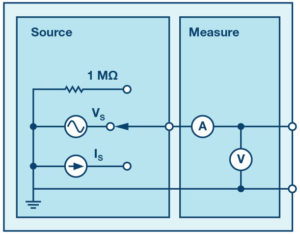
As in all the ALM labs, we use the following terminology when referring to the connections to the ALM1000 connector and configuring the hardware. The green shaded rectangles indicate connections to the ADALM1000 analogue I/O connector. The analogue I/O channel pins are referred to as CA and CB. When configured to force voltage/measure current, -V is added (as in CA-V) or when configured to force current/measure voltage, -I is added (as in CA-I). When a channel is configured in the high impedance mode to only measure voltage, -H is added (as in CA-H).
Scope traces are similarly referred to by channel and voltage/current, such as CA-V and CB-V for the voltage waveforms, and CA-I and CB-I for the current waveforms.
We are using the ALICE Rev 1.1 software for those examples here. File: alice-desktop-1.1-setup.zip. Please download here.
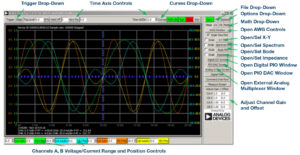
The ALICE Desktop software provides the following functions:
- A 2-channel oscilloscope for time domain display and analysis of voltage and current
- The 2-channel arbitrary waveform generator (AWG) controls.
- The X and Y display for plotting captured voltage and current voltage and current data, as well as voltage waveform histograms.
- The 2-channel spectrum analyser for frequency domain display and analysis of voltage
- The Bode plotter and network analyser with built-in sweep generator.
- An impedance analyser for analysing complex RLC networks and as an RLC meter and vector
- A dc ohmmeter measures unknown resistance with respect to known external resistor or known internal 50Ω.
- Board self-calibration using the AD584 precision 2.5V reference from the ADALP2000 analogue parts kit.
- ALICE M1K voltmeter.
- ALICE M1K meter
- ALICE M1K desktop
For more information, please look here.