The purpose of this activity is to investigate the current vs. voltage characteristics of a PN junction diode.
Written by Antoniu Miclaus and Doug Mercer of Analog Devices
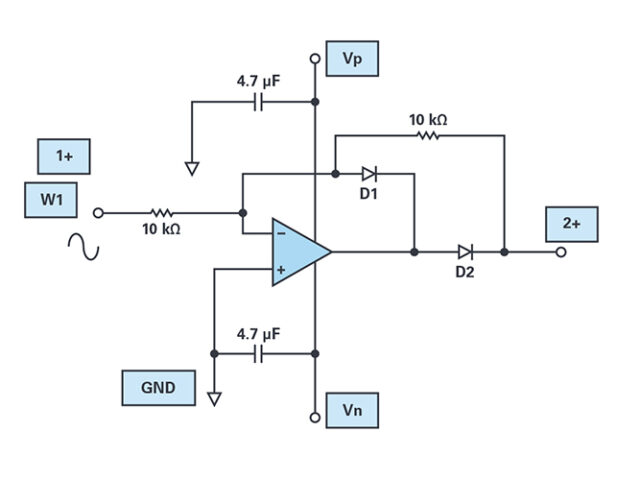
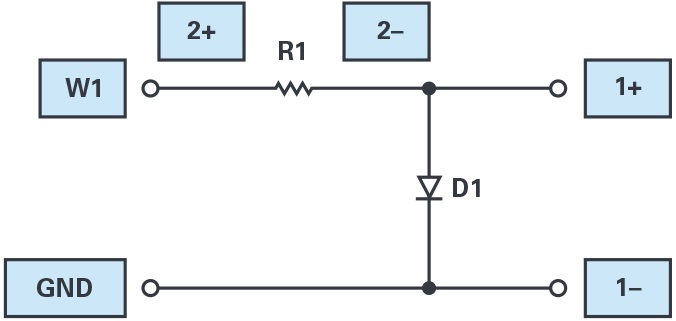
The current vs. voltage characteristics of the PN junction diode can be measured using the ADALM2000 board and the following connections. The blue boxes indicate where to connect the ADALM2000 board. Set up the breadboard with waveform generator output W1, which is attached to one end of the resistor. The 2+ scope input is also connected here. The other end of the resistor is connected to one end of the diode, as shown in Figure 1. The 2– scope input and the 1+ scope input are connected to the second end of the resistor. The other end of the diode is connected to ground, along with the 1– scope input.
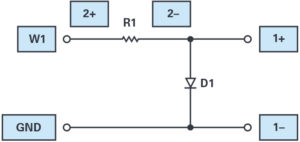
Figure 1. Connection diagram for diode I/V curves.
The waveform generator should be configured for a 100 Hz triangle wave with 6V amplitude and 0V offset. The differential input of Scope Channel 2 (2+, 2–) is used to measure the current in the resistor (and diode). The single-ended input of Scope Channel 1 (1+) is used to measure the voltage across the diode (1– input can be grounded). The scope should be setup with Channel 1 at 500 mV per division and Channel 2 set also at 500 mV per division. The current flowing through the diode ID is the voltage measured by Channel 2 divided by the resistor value (1 kΩ in this example). Use the XY display mode to plot the voltage across the diode (Scope Channel 1) on the x-axis vs. the current in the diode (Scope Channel 2) on the y-axis.
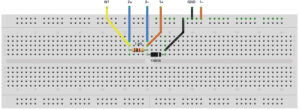
Figure 2. Current vs. voltage, linear scales.
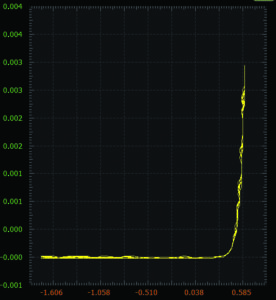
Figure 3. Current vs. voltage (linear scales Scopy plot).
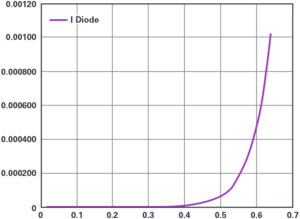
Figure 4. Current vs. voltage (linear scales Excel plot).
Load the captured data into a spreadsheet program like Excel and calculate the diode current ID. Plot the current vs. the voltage across the diode. The diode voltage and current relationship is logarithmic. If plotted on a log scale, the line should be straight, as seen in Figure 5.
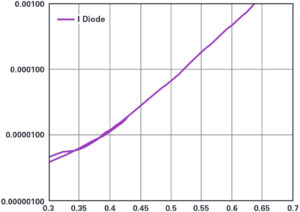
Figure 5. Current vs. voltage on a log scale.
Further exploration on diode characteristics
Measure the diode characteristics, VD at a fixed ID, of multiple 1N914 diodes; there should be four included in the ADALP2000 analog parts kit and you can ask to exchange some with a lab-mate to get even more samples. Calculate the mean and coefficient of variation (CV) of your measurements (CV is defined as the standard deviation divided by the mean as a percentage). Discuss the amount of variation you observe, which is often a measure of what semiconductor engineers call process variation.
Replace the 1N914 diodes with a light-emitting diode (LED). You should have red, yellow, green, and infrared LEDs in the ADALP2000 analog parts kit. Do the LEDs have similar mathematical expressions for the diode current ID given the voltage across the diode VD as the 1N914? In what way are they similar and in what way are they different? Do the red, yellow, and green LEDs turn on at the same forward voltage?
Question
What is the mathematical expression for the diode current ID given the voltage across the diode VD?
You can find the answers at the StudentZone blog, as well as further information on the topic.