The purpose of this activity is to investigate the use of a diode as a half-wave rectifier and two diodes as a full-wave rectifier.
Written by Antoniu Miclaus and Doug Mercer of Analog Devices
Half-wave rectifier
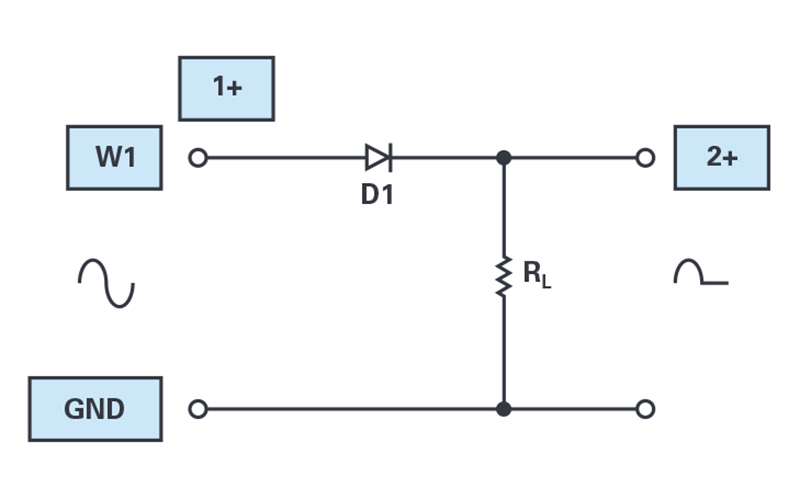
Set up the breadboard with waveform generator output W1 attached to one end of the diode. The other end of the diode is connected to one end of the load resistor, as shown in Figure 6. The other end of the resistor is connected to ground. The single-ended input of Scope Channel 2 (2+) is also connected to the end of the resistor not connected to ground (2– input can be grounded).
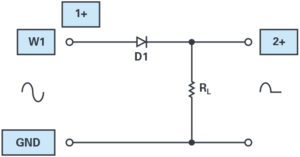
Figure 6. Connection diagram for a half-wave diode rectifier.
The waveform generator should be configured for a 100 Hz sine wave with 6 V amplitude and 0 V offset. Scope Channel 2 (2+) is used to measure the voltage across the load resistor RL. Both scope channels should be set to 500 mV per division.
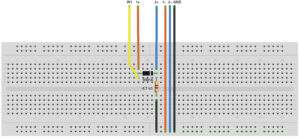
Figure 7. Half-wave diode rectifier breadboard circuit.
Plot the two waveforms using the oscilloscope feature from the Scopy tool.
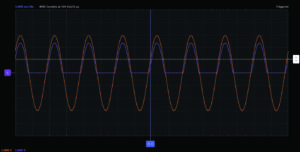
Figure 8. Half-wave rectified waveform.
Further exploration
Replace the 1N914 diode with a light emitting diode. You probably need to increase the AWG1 amplitude to 10 V to accommodate the higher forward voltage drop of the LED.
- How does the waveform for the rectified output compare to your earlier results with the 1N914 diode? By how much does the forward-bias voltage drop increase?
- Experiment with the three different waveform shapes while the wave-form generator remains set to 100 Hz and pay attention to the brightness of the LED. Discuss your observations of waveform shape and brightness and relate these observations to your measured effective dc values for each waveform shape.
- Reduce the waveform generator frequency, and experiment with values as low at 0.2 Hz (one cycle every five seconds). Discuss the behaviour of the LED optical intensity for each of the three waveform shapes when the waveform generator frequency is 1 Hz or less.
- At what frequency does the flashing LED stop flickering and begin to appear as a constant intensity?
Questions
- Why is the peak value of the rectified output less than the peak value of the ac input and by how much?
- At what point in the input waveform does the rectified waveform become positive; that is, something other than zero?
- What happens if the direction of the diode is reversed?
Repeat the experiment with the direction of the diode reversed.
Full-wave rectifier
Set up the breadboard with W1 attached to one end of the first diode, D1, and W2 to one end of the second diode, D2. Both diodes should face in the same direction. The other end of each diode is connected to one end of the load resistor, as shown Figure 9. The other end of the resistor is connected to ground. The single-ended input of Scope Channel 2 (2+) is connected to the junction of the resistor and the two diodes.
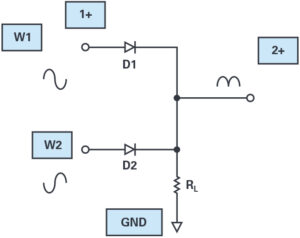
Figure 9. Connection diagram for a full-wave diode rectifier.
The first waveform generator, W1, should be configured for a 100 Hz sine wave with 6 V amplitude and 0 V offset. The second AWG generator, W2, should be configured also for a 100 Hz sine wave with 6 V amplitude and 0 V offset but with the phase set to 180°. The single-ended input of Scope Channel 2 (2+) is used to measure the voltage across the load resistor. Both scope channels should be set to 500 mV per division.
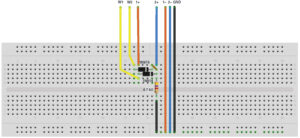
Figure 10. Full-wave diode rectifier breadboard circuit.
Plot the two waveforms using the oscilloscope provided by the Scopy tool. If both 0° and 180° phases of the ac input are available, then a second diode can fill in the missing half-wave of the input and produce the full-wave rectified signal, as shown in Figure 11. Again, the forward voltage of the diodes is apparent, and the output waveform does not come to a sharp point at the zero crossing due to the non-zero turn on voltage of the diodes.
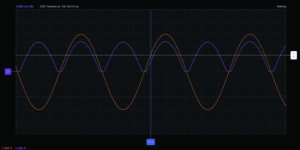
Figure 11. Full-wave rectified waveform.
Further exploration
Replace D1 and D2 with red and green LEDs. Increase the amplitude of AWG1 to 10 V (to accommodate the higher turn on voltage of the LEDs). Slow the frequency of AWG1 to 5 Hz or less. Are the two LEDs ever both on at the same time?
- How does the waveform for the rectified output compare to your earlier results with the 1N914 diodes? By how much does the forward-bias voltage drop increase?
- Experiment with the three different waveform shapes while the waveform generator is set to 100 Hz, pay attention to the brightness of the LEDs. Discuss your observations of waveform shape and brightness and relate these observations to your measured effective dc values for each waveform shape.
- Reduce the waveform generator frequency, and experiment with values as low at 0.2 Hz (one cycle every five seconds). Discuss the behavior of the LED optical intensity for each of the three waveform shapes when the waveform generator frequency is 1 Hz or less.
- At what frequency do the flashing LEDs stop flickering and begin to appear as a constant intensity?
Questions
- What happens if the direction of the diodes is reversed? Repeat the experiment with the direction of both diodes reversed.
- What happens if the direction of one diode is opposite of the other? Repeat the experiment with the direction of one diode (D1) reversed.
- How could both 0° and 180° phases be created from a single source (such as a transformer)?
You can find the answers at the StudentZone blog, as well as further information on the topic. View the previous and next posts in this section on diodes.