After the introduction of the SMU ADALM1000 let’s start with the first of some small, basic measurements.
Written by Doug Mercer, Analog Devices
Now let’s get started with the second experiment.
Objective
The objective of this lab activity is to verify the proportionality and superposition theorems.
Background
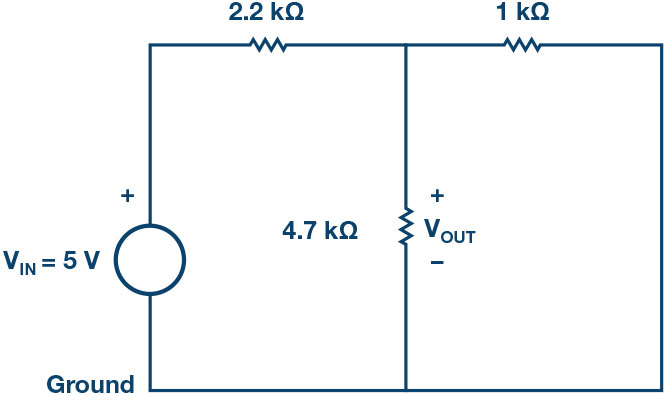
In this activity, the proportionality and superposition theorems are examined by applying them to the circuits shown in the following figures.
- The proportionality theorem states that the response of a circuit is proportional to the source acting on the circuit. This is also known as linearity. The proportionality constant A relates the input voltage to the output voltage as:
The proportionality constant A is sometimes referred to as the gain of a circuit. For the circuit of Figure 2, the source voltage is VIN. The response VOUT is across the 4.7 kΩ resistor. The most important result of linearity is superposition.
- The proportionality constant is sometimes referred to as the gain of a circuit. For the circuit of Figure 2, the source voltage is . The response is across the 4.7 kΩ resistor. The most important result of linearity is superposition.
Materials
- ADALM1000 hardware module.
- Various resistors: 1 kΩ, 2.2 kΩ, and 4.7 kΩ.
Procedure
1. Verify the voltage division:
- a) Construct the circuit of Figure Using the voltmeter tool, accurately measure for the three input voltages (using the ALM1000 fixed power supply voltages) as shown in Table 1. You should measure and record the actual fixed power supply voltages as well.
Table 1. Enter Your Results
| (volts) | (volts) | (no units) |
| 2.5 V | ||
| 3.3 V | ||
| 5.0 V |
- b) Calculate the value of in each case using Equation 1.
- c) Plot a graph with on the x-axis and on the y-axis.
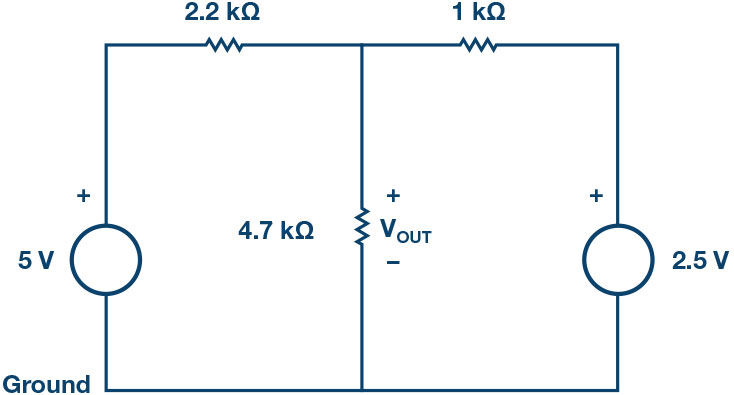
2. Verifying the superposition theorem:
- Construct the circuit of Figure 3. Measure and record the voltage across the 4.7 kΩ resistor.
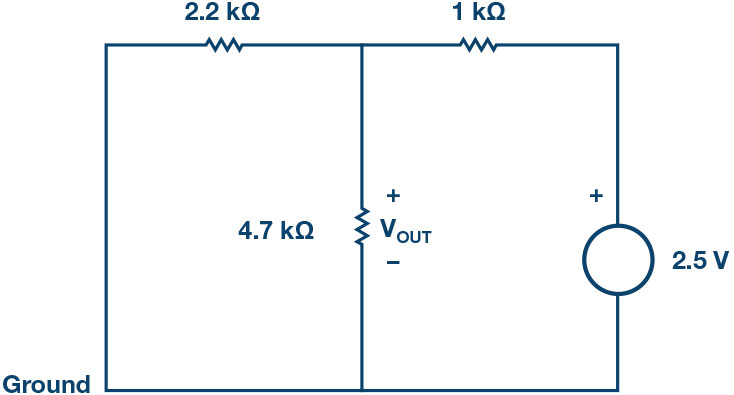
- Construct the circuit of Figure 4. Measure and record the voltage across the 4.7 kΩ resistor.
- Calculate the total response for the circuit of Figure 3 by adding the responses from Step 1a and Step Compare your calculated result to what you measured in Step 2a. Explain any differences.
Questions
- Is the graph obtained a straight line? Compute the slope of the graph at any point and compare it to the value of K obtained from the Explain any differences.
- For each of the three circuits you built for the superposition experiment, how well did the calculated and measured outputs compare? Explain any differences.
You can find the answers at the Analog Devices StudentZone blog.
Notes
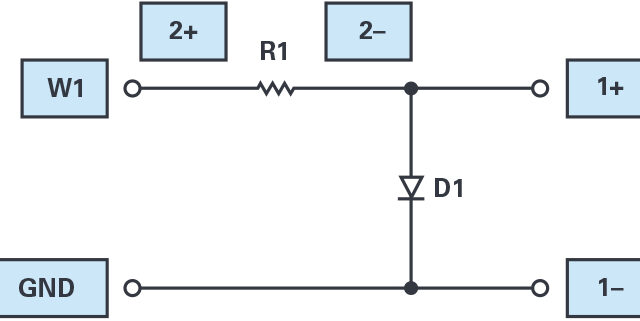
As in all the ALM labs, we use the following terminology when referring to the connections to the ALM1000 connector and configuring the hardware. The green shaded rectangles indicate connections to the ADALM1000 analog I/O connector. The analog I/O channel pins are referred to as CA and CB. When configured to force voltage/measure current, –V is added as in CA-V or when configured to force current/measure voltage, –I is added as in CA-I. When a channel is configured in the high impedance mode to only measure voltage, –H is added as CA-H.
Scope traces are similarly referred to by channel and voltage/current, such as CA-V and CB-V for the voltage waveforms, and CA-I and CB-I for the current waveforms.
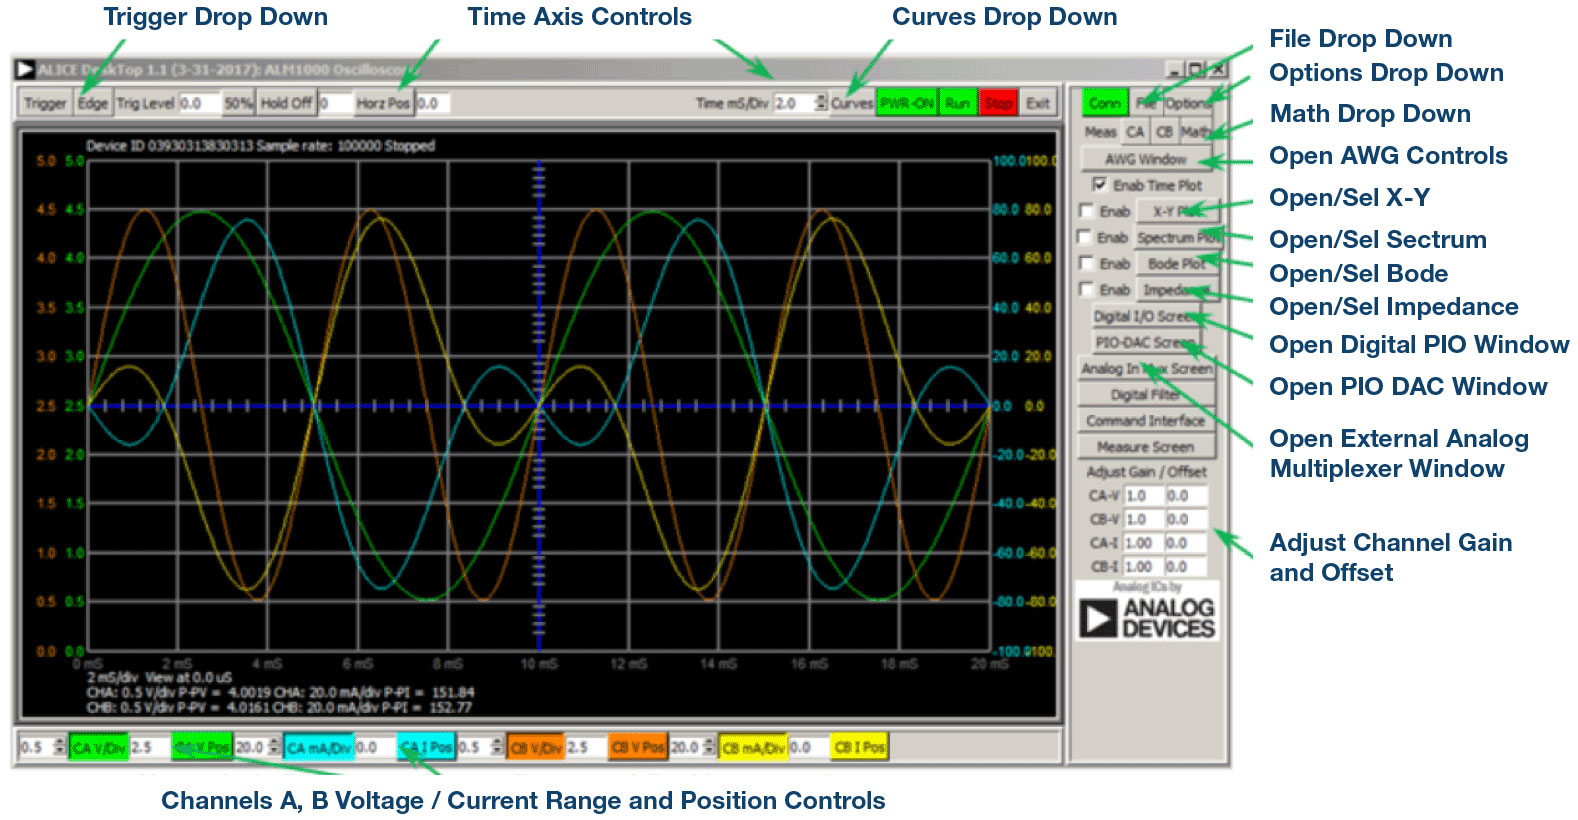
It is advised to use the ALICE Rev 1.1 software for those examples here. File: alice-desktop-1.1-setup.zip. Please download here.
The ALICE desktop software provides the following functions:
- A 2-channel oscilloscope for time domain display and analysis of voltage and current
- The 2-channel arbitrary waveform generator (AWG) controls.
- The X and Y display for plotting captured voltage and current voltage and current data, as well as voltage waveform histograms.
- The 2-channel spectrum analyzer for frequency domain display and analysis of voltage
- The Bode plotter and network analyzer with built-in sweep generator.
- An impedance analyzer for analyzing complex RLC networks and as an RLC meter and vector
- A dc ohmmeter measures unknown resistance with respect to known external resistor or known internal 50 Ω.
- Board self-calibration using the AD584 precision 2.5 V reference from the ADALP2000 analog parts kit.
- ALICE M1K voltmeter.
- ALICE M1K meter source.
- ALICE M1K desktop tool.
For more information, please look here.
Note: You need to have the ADALM1000 connected to your PC to use the software.
Author: Doug Mercer [doug.mercer@analog.com] received his B.S.E.E. degree from Rensselaer Polytechnic Institute (RPI) in 1977. Since joining Analog Devices in 1977, he has contributed directly or indirectly to more than 30 data converter products and he holds 13 patents. He was appointed to the position of ADI Fellow in 1995. In 2009, he transitioned from full-time work and has continued consulting at ADI as a Fellow Emeritus contributing to the Active Learning Program. In 2016 he was named Engineer in Residence within the ECSE department at RPI.