After the introduction of the SMU ADALM1000 lets continue with the sixteenth part in the series with some small, basic measurements.
Written by Doug Mercer and Antoniu Miclaus
Objective:
The objective of this lab activity is to measure the impedance profile and the resonant frequency of a permanent magnet loudspeaker.
Background:
The chief electrical characteristic of a dynamic loudspeaker is its electrical impedance as a function of frequency. It can be visualised by plotting it as a graph, called the impedance curve.
The most common type of loudspeaker is an electromechanical transducer using a voice coil connected to a diaphragm or cone. The voice coil in moving coil loudspeakers is suspended in a magnetic field provided by a permanent magnet. As electric current flows through the voice coil from an audio amplifier, the electromagnetic field created by the current in the coil reacts against the permanent magnet’s fixed field and moves the voice coil and loudspeaker cone. Alternating current will move the cone back and forth. This motion vibrates the air and produces sound.
The moving system of the loudspeaker, including the cone, spider, cone suspension, and voice coil, has a certain mass and a specific order. This is most commonly modelled as a simple mass suspended by a spring that has a certain resonant frequency at which the system will vibrate most freely.
This frequency is known as the free-space resonance of the speaker and is designated by FS. At this frequency, since the voice coil is vibrating with the maximum peak-to-peak amplitude and velocity, the back EMF generated by coil motion in a magnetic field is also at its maximum. This causes the effective electrical impedance of the speaker to be at its maximum at FS, known as ZMAX. For frequencies just below resonance, the impedance rises rapidly as the frequency approaches FS and is inductive in nature. At resonance, the impedance is purely resistive and, beyond it, as the impedance drops, it looks capacitive.
The impedance reaches a minimum value, ZMIN at some frequency where the behaviour is mostly (but not perfectly) resistive over some range of frequencies. A speaker’s rated or nominal impedance, ZNOM, is derived from this ZMIN value.
Knowing the resonant frequency and the minimum and maximum impedances are important when designing crossover filter networks for multiple driver speakers and the physical enclosure in which the speakers are mounted.
Loudspeaker impendence model
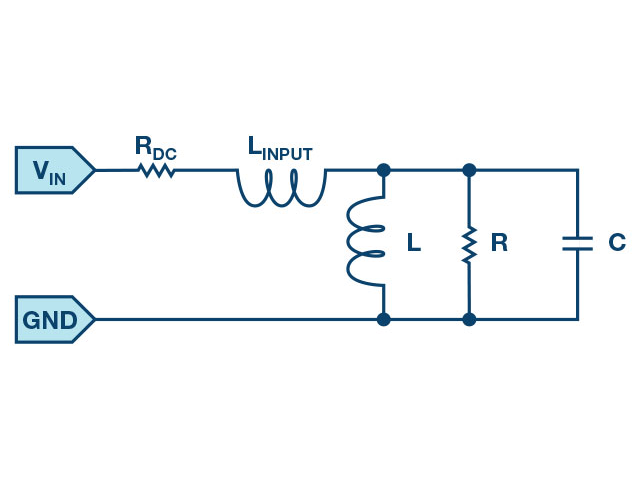
To help understand the measurements you are about to make, a simplified electrical model of a loudspeaker is shown in Figure 1.
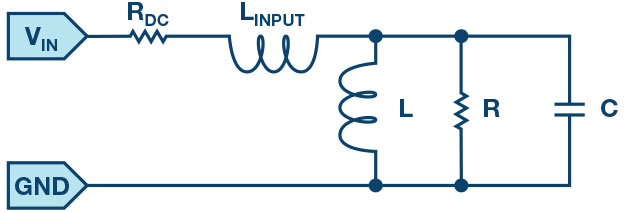
The circuit in Figure 1 has a dc resistance placed in series with a lossy parallel resonant circuit made up of L, R, and C, which models the dynamic impedance of the speaker over the frequency range of interest.
- RDC is the dc resistance of the loudspeaker as measured with a dc The dc resistance is often referred to as the DCR in a speaker/subwoofer data sheet. The dc resistance measurement is usually less than the driver’s nominal impedance ZNOM. RDC is typically less than the specified loudspeaker impedance and the novice loudspeaker enthusiast may be fearful that the driver amplifier will be overloaded. However, because the inductance (L) of a speaker increases with an increase in frequency, it is unlikely that the driver amplifier sees the dc resistance as its load.
- L is the voice coil inductance usually measured in millihenries (mH). Typically, the industry standard is to measure the voice coil inductance at 1000Hz. As frequencies increase above 0Hz, there is an increase in impedance above the RDC This is because the voice coil acts as an inductor. Consequently, the overall impedance of a loudspeaker is not a constant impedance. So, it can be represented as a dynamic profile that changes with input frequency as we will see when we make measurements. The maximum impedance, ZMAX, of the loudspeaker occurs at the resonant frequency of the loudspeaker.
- FS is the resonant frequency of a loudspeaker. The impedance of a loudspeaker reaches its maximum at FS. The resonant frequency is the point at which the total mass of the moving parts of the loudspeaker become balanced with the force of the speaker suspension when in motion. The resonant frequency information is important to prevent an enclosure from ringing. In general, the mass of the moving parts and the stiffness of the speaker suspension are the key elements that affect the resonant frequency. A vented enclosure (bass reflex) is tuned to FS so that the two work in unison. As a rule, a speaker with a lower FS is better for low frequency reproduction than a speaker with a higher FS.
- R represents the mechanical resistance of a driver’s suspension
Materials:
- ADALM1000 hardware module
- Solderless breadboard
- Two 100Ω (or any similar value) resistors
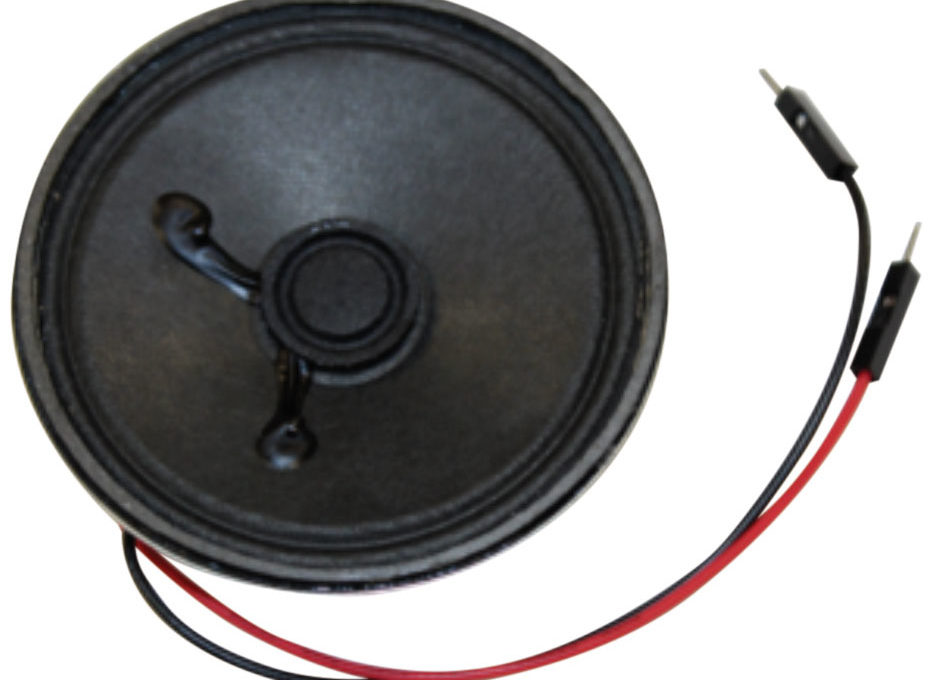
- One loudspeaker from the ADALP2000 kit (it is even better if the speaker is one with a cone diameter larger than 4 inches so that is has a relatively low resonant frequency)
Directions:
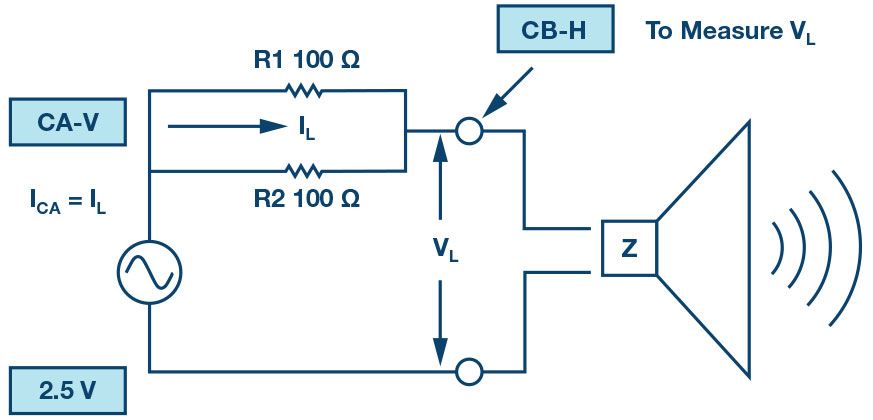
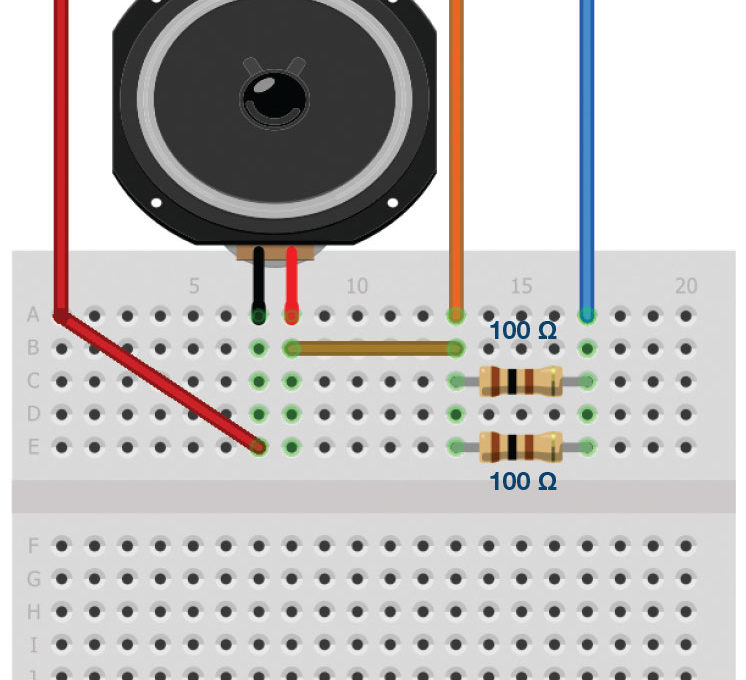
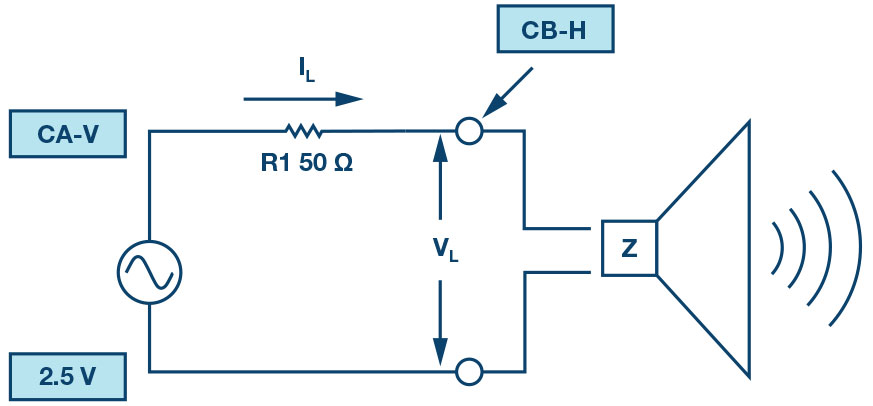
First build the circuit shown in Figure 3, preferably using your solderless breadboard. The loudspeaker can be in an enclosure or not. This configuration allows us to measure the voltage across the speaker VL using Channel B voltage trace and the load current IL as the Channel A current trace.
Start the ALICE Desktop software. In the main scope screen, the ALICE software calculates and can display the rms values of the voltage and current waveform traces. Under the CA Meas drop-down menu, in the voltage section, select RMS, and in the current section, select RMS. Under the CB Meas drop-down menu, in the voltage section, select RMS.
We can calculate the speaker impedance Z at a single frequency by dividing the rms voltage across the speaker (Channel B rms voltage) by the rms current through the speaker (Channel A rms current). To display this calculation, we can use the Channel B User measurement display. The two variables used are SV2 for the Channel B rms voltage and SI1 for the Channel A rms current. Click on User under the CB Meas drop-down menu. Enter Z for the label. Enter (SV2/SI1) ×1000 as the formula. Because the current is represented in mA, we need to multiply the ratio by 1,000 to get the result in ohms.
Try setting Channel A to a few different frequencies and see how the voltage across the speaker and the calculated Z changes.
Procedure to use the ALICE Bode Plotter:
Select the Bode Plotting tool. Under the Curves menu, select CA-dBV, CB-dBV, and Phase B-A.
Under the options drop-down menu, click on Cut-DC to select it if it not selected already. Change the FFT Zero Stuffing Factor to 3.
Set the Channel A Min value to 1.0V and the Max to 4.0V. Set AWG A Mode to SVMI and Shape to Sine. Set AWG Channel B Mode to Hi-Z. Be sure the Sync AWG check box is selected.
Use the Start Frequency entry to set the frequency sweep to start at 50Hz and use the Stop Frequency entry to set the sweep to stop at 1000Hz. Select CHA as the source channel to sweep. Also use the Sweep Steps entry to set the number of frequency steps to 150. Select Single Sweep.
Now export the data as magnitude, instead of in dB, to make the math easier, to a comma separated values file (File menu – Save Data) and load it into a spreadsheet program such as Excel. You will use the 50Hz to 1000Hz Channel B data from this file as the VL values.
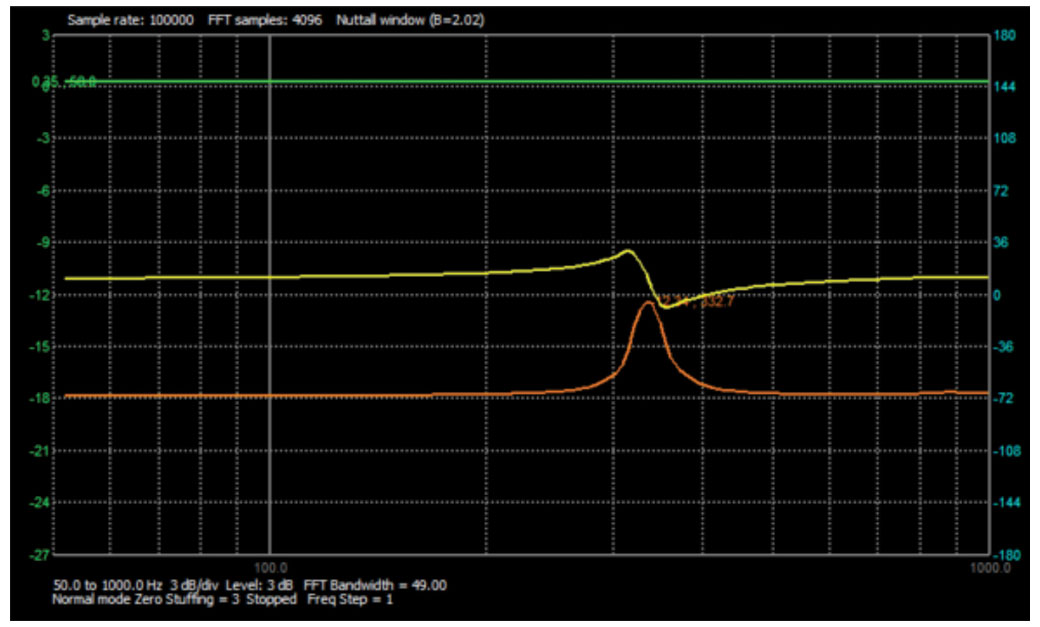
Note the frequency points where the phase is at its positive maximum, zero, and its negative minimum. The data on the screen is plotted in dB so the vertical scale is not in volts. Your speaker will probably look different than this example.
By saving the data as magnitude, the signal generator amplitude (in volts rms) is saved to the file. You can calculate the magnitude of the speaker impedance Z by dividing the voltage across the speaker VL by the current IL. IL is the voltage across the resistor divided by the resistance.
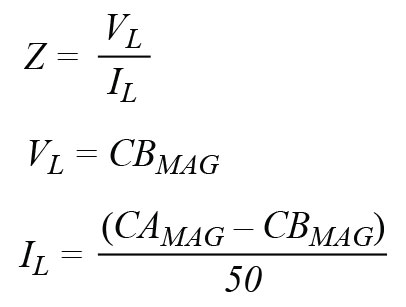
Subtracting the Channel B voltage magnitude values from the Channel A voltage magnitude values and dividing by the 50Ω resistor will allow you to calculate the current magnitude IL. The impedance Z will be the Channel B voltage magnitude divided by the current magnitude IL.
You can now plot the calculated impedance Z vs. frequency. An example plot is shown in Figure 6. Your speaker will probably look different than this.
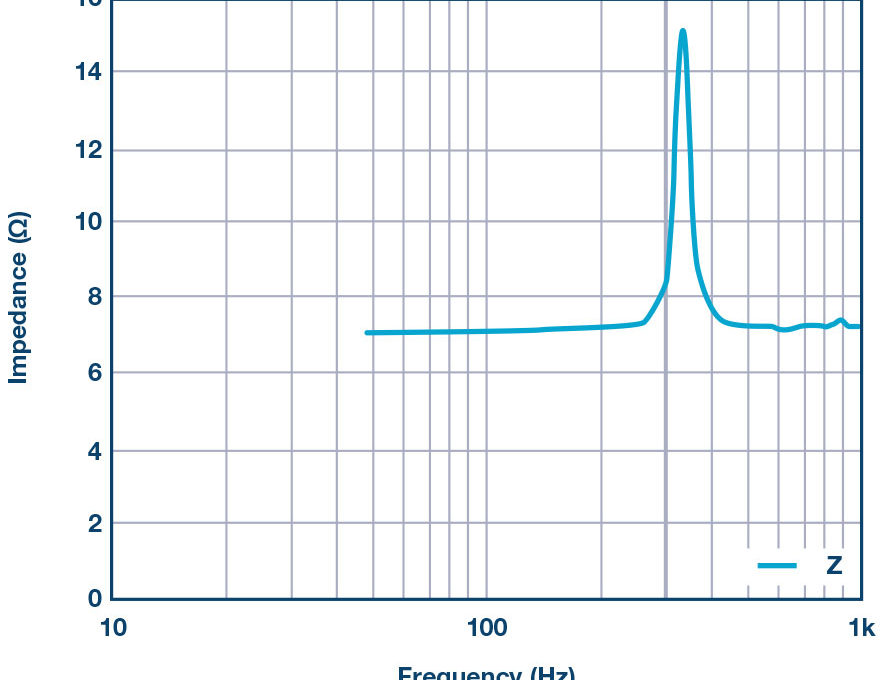
The speaker impedance is small—approximately equal to the dc resistance in the linear region—but is much higher at the resonance frequency FS.
Questions:
Based on your measured data, extract the L, C, and R for the speaker electrical model shown in Figure 1 for the speaker you used. You can measure RDC with the dc ohmmeter tool. Ignore LINPUT as it will be small compared to L. Enter these values into a circuit simulation schematic of the model and generate a frequency response sweep from 50 Hz to 1000 Hz and compare your model to the data you measured in the lab.
Procedure to use the ALICE Impedance Analyser to measure speaker impedance:
Channel B again measures the voltage VL across the speaker. The impedance analyser software uses the difference between the Channel A voltage and Channel B voltage, as well as the relative phase between the channels to calculate the impedance based the value of the combined R1 and R2.
Open the ALICE Impedance Analyser software tool.
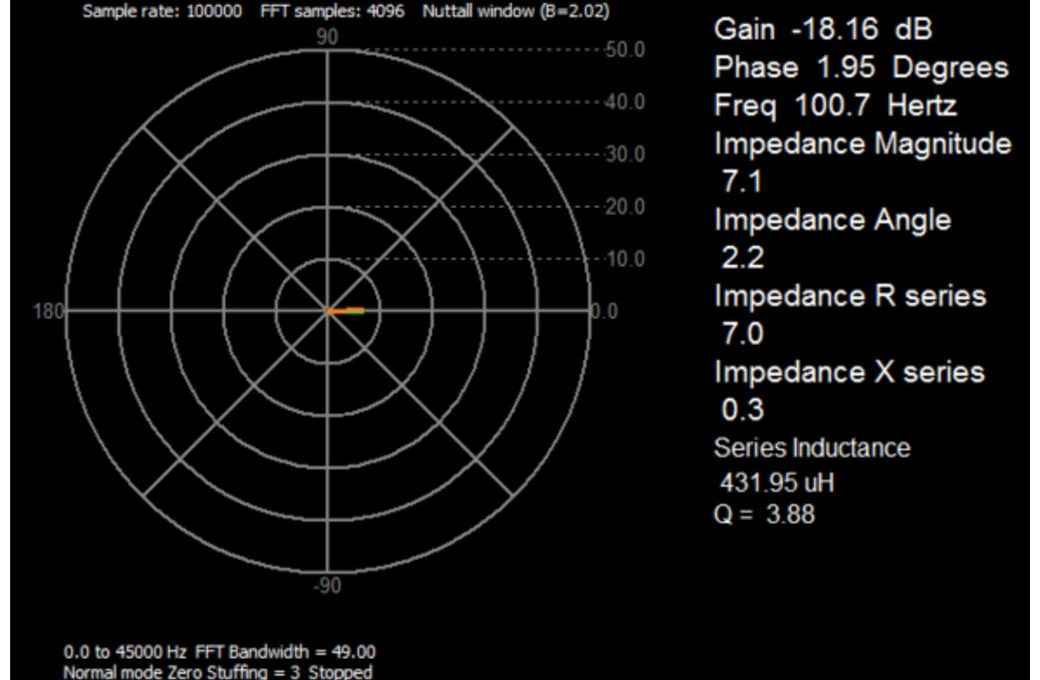
Set Ext Res = 50, set Channel A Freq to a value well below the resonate frequency of your speaker. In this first example measurement, 100Hz was used. Set Ohms/div to 10. As can be seen from Figure 8, the phase angle should be positive. The series resistance of the speaker is around 7Ω and the reactance is inductive.
Now set the frequency to the resonant value you obtained from the frequency sweep. You may want to finely adjust the value to find the exact point where the reactance is zero as shown in Figure 9.
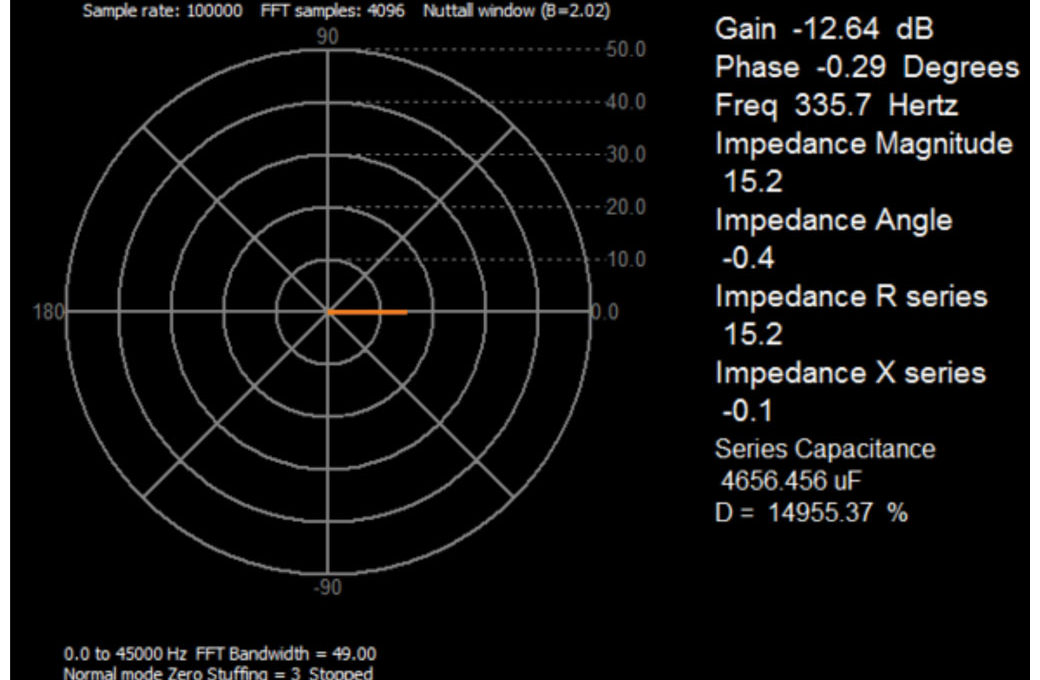
This result should agree with the results from the frequency sweeps. The phase angle should be small, and the series resistance is now larger by about 15Ω.
Now set the frequency to a point above the resonant frequency where the phase is near its negative peak, as shown in Figure 10. 500Hz was used here.
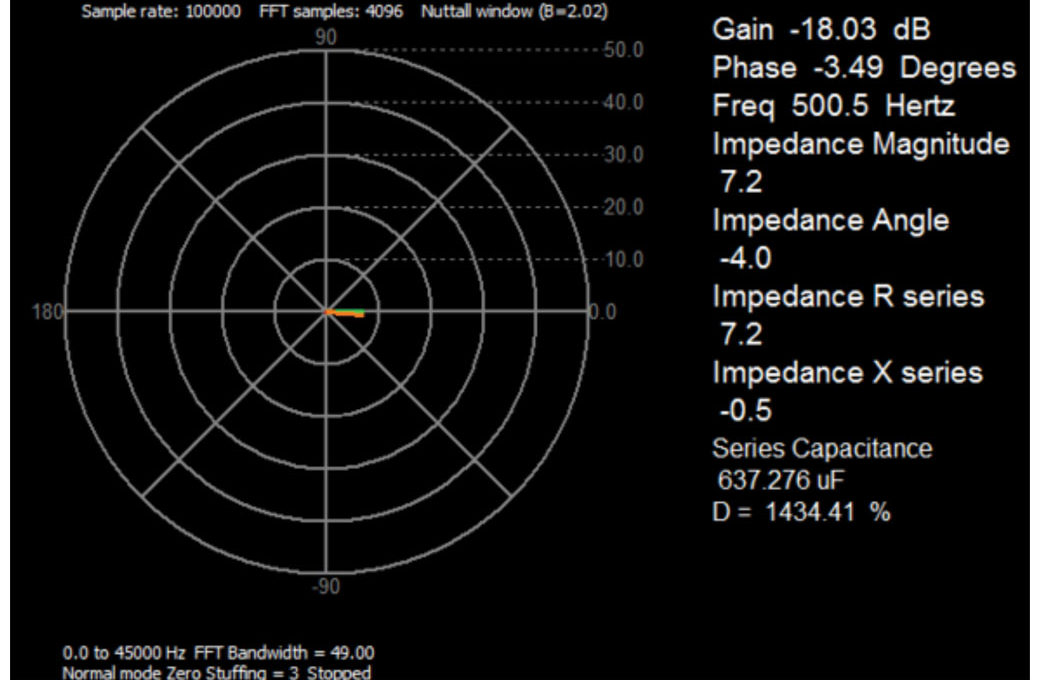
As can be now seen from the data, the phase angle should be negative. The series resistance of the speaker is still around 7Ω, but the reactance is capacitive.
Notes:
As in all the ALM labs, we use the following terminology when referring to the connections to the ADALM1000 connector and configuring the hardware. Green shaded rectangles indicate connections to the ADALM1000 analogue I/O connector. The analogue I/O channel pins are referred to as CA and CB. When the hardware is configured to force voltage/measure current, -V is added, as in CA-V. When it is configured to force current/measure voltage, -I is added, as in CA-I. When a channel is configured in the high impedance mode to only measure voltage, -H is added, as in CA-H.
Scope traces are similarly referred to by channel and voltage/current, such as CA-V, CB-V for the voltage waveforms and CA-I, CB-I for the current waveforms.
Doug Mercer received his B.S.E.E. degree from Rensselaer Polytechnic Institute (RPI) in 1977. Since joining Analog Devices in 1977, he has contributed directly or indirectly to more than 30 data converter products and he holds 13 patents. He was appointed to the position of ADI Fellow in 1995. In 2009, he transitioned from full-time work and has continued consulting at ADI as a Fellow Emeritus contributing to the Active Learning Programme. In 2016 he was named Engineer in Residence within the ECSE department at RPI.
Antoniu Miclaus is a system applications engineer at Analog Devices, where he works on ADI academic programmes, as well as embedded software for Circuits from the Lab and QA process management. He started working at Analog Devices in February 2017 in Cluj-Napoca, Romania. He is currently an M.Sc. student in the software engineering master’s program at Babes-Bolyai University and he has a B.Eng. in electronics and telecommunications from Technical University of Cluj-Napoca.