After the introduction of the SMU ADALM1000 lets continue with the tenth part of our series with some small, basic measurements.
Written by Doug Mercer and Antoniu Miclaus, Analog Devices
The objective of this lab activity is to study the characteristics of passive filters by obtaining the frequency response of a low-pass RC filter and high-pass RL filter.
Passive filters consist of passive components, such as resistors, capacitors, and inductors, that have no amplifying elements, such as op amps, and transistors. The output level of the passive filters is always less than the input since they have no signal gain.
The impedance of capacitors and inductors are frequency dependent. The impedance of an inductor is proportional to frequency and the impedance of a capacitor is inversely proportional to frequency. These characteristics can be used to select or reject certain frequencies of an input signal. This selection and rejection of frequencies is called filtering, and a circuit that does this is called a filter.
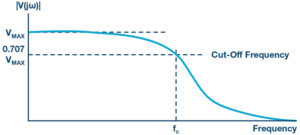
If a filter passes high frequencies and rejects low frequencies, then it is a high-pass filter. Conversely, if it passes low frequencies and rejects high ones, it is a low-pass filter. Filters, like most things, aren’t perfect. They don’t absolutely pass some frequencies and absolutely reject others. A frequency is considered passed if its magnitude (voltage amplitude) is within 70% or 1/√2 of the maximum amplitude passed and rejected otherwise. The 70% frequency is called cut-off frequency, roll-off frequency, or half-power frequency.
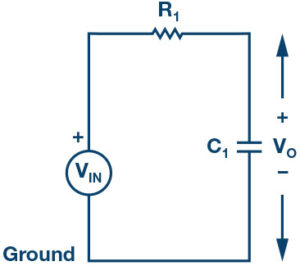
At low frequencies, the impedance of the capacitor will be very large compared to the resistive value of the resistor, R. This means that the voltage potential, Vo, across the capacitor will be much larger than the voltage drop across the resistor. Therefore, at high frequencies the reverse is true, with Vo being small and VR1 being large due to the change in the capacitor impedance value.
The cut-off frequencies for an RC filter:
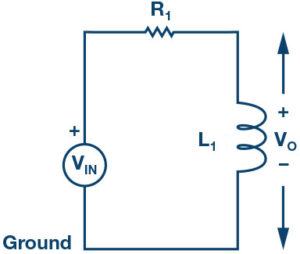
At low frequencies, the impedance of the inductor will be very small compared to the resistive value of the resistor, R. This means that the voltage potential, Vo, across the inductor will be much smaller than the voltage drop across the resistor. Therefore, at high frequencies the reverse is true, with Vo being large and VR1 being small due to the change in the inductor impedance value.
The cut-off frequencies for an RL filter:
Frequency response: A graph of the magnitude of the output voltage of the filter as a function of the frequency. It is generally used to characterise the range of frequencies that the filter is designed to operate within.
Materials:
- ADALM1000 hardware module
- Resistors (1 kΩ) X Capacitor (1 µF) X Inductor (20 mH)
Procedure:
Low-pass RC filter:
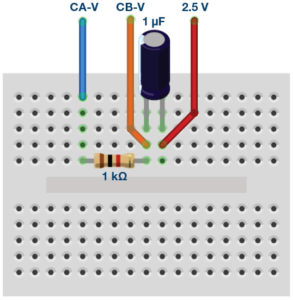
- Set up the RC circuit as shown in Figure 1 on your solderless bread- board, with the component values R1 = 1kΩ, C1 = 1µF.
- Set the Channel A AWG min value to 0.5V and max value to 4.5V to apply a 4V p-p sine wave centred on 5V as the input voltage to the circuit. From the AWG A Mode drop-down menu, select SVMI mode. From the AWG A Shape drop-down menu, select Sine. From the AWG B Mode drop-down menu, select the Hi-Z mode.
- From the ALICE Curves drop-down menu, select CA-V and CB-V for From the Trigger drop-down menu, select CA-V and Auto Level. Set the Hold Off to 2 (ms). Adjust the time base until you have approximately two cycles of the sine wave on the display grid. From the Meas CA drop-down menu, select P-P under CA-V and do the same for CB. Also, from the Meas CA menu, select A-B Phase.
- Start with a low frequency, 50Hz, and measure output voltage CB-V peak to peak from the scope screen. It should be the same as the channel A output. Increase the frequency of Channel A in small increments until the peak-to-peak voltage of Channel B is roughly 0.7 times the peak-to-peak voltage for Channel A. Compute 70% of V p-p and obtain the frequency at which this happens on the oscilloscope. This gives the cut-off (roll-off) frequency for the constructed low-pass RC.
High-pass RL filter:
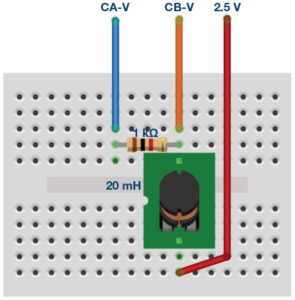
- Set up the RL circuit as shown in Figure 2 on your solderless bread- board, with the component values R1 = 1 kΩ, L = 20
- Repeat Steps 2 and 3, as in part A, to obtain the oscilloscope.
- Start with a high frequency, 20 kHz, and measure output voltage CB-V peak to peak from the scope screen. It should be the same as the Channel A Lower the frequency of Channel A in small increments until the peak-to-peak voltage of Channel B is roughly 0.7 times the peak-to-peak voltage for Channel A. Compute 70% of V p-p and obtain the frequency at which this happens on the oscilloscope. This gives the cut-off (roll-off) frequency for the constructed high-pass RL filter.
Questions:
Calculate the cut-off frequencies for the RC low-pass and RL high-pass filter using Equation 1 and Equation 2. Compare the computed theoretical values to the ones obtained from the experimental measurements and provide a suitable explanation for any differences.
Appendix:
Using other component values
It is possible to substitute other component values in cases where the specified values are not readily available. The reactance of a component (XC or XL) scales with frequency. For example, if 4.7mHz inductors are available rather than the 47mHz called for, all that is needed is to increase the test frequency from 250 Hz to 2.5 kHz. The same would be true when substituting a 1.0 µF capacitor for the 10.0 µF capacitor specified.
Using the RLC impedance meter tool
ALICE Desktop includes an impedance analyser/RLC meter that can be used to measure the series resistance (R) and reactance (X). As part of this lab activity, it might be informative to use this tool to measure the components R, L, and C used to confirm your test results.
You can find the answers at the StudentZone blog.
Notes
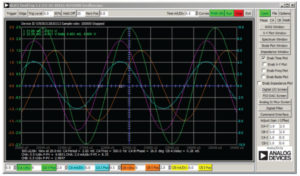
As in all the ALM labs, we use the following terminology when referring to the connections to the ALM1000 connector and configuring the hardware. The green shaded rectangles indicate connections to the ADALM1000 analogue I/O connector. The analogue I/O channel pins are referred to as CA and CB. When configured to force voltage/measure current, –V is added (as in CA-V) or when configured to force current/measure voltage, –I is added (as in CA-I). When a channel is configured in the high impedance mode to only measure voltage, –H is added (as in CA-H).
Scope traces are similarly referred to by channel and voltage/current, such as CA-V and CB-V for the voltage waveforms, and CA-I and CB-I for the current waveforms.
We are using the ALICE Rev 1.1 software for those examples here. File: alice-desktop-1.1-setup.zip. Please download here.
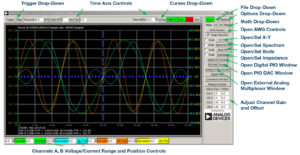
The ALICE Desktop software provides the following functions:
- A 2-channel oscilloscope for time domain display and analysis of volt- age and current
- The 2-channel arbitrary waveform generator (AWG) controls.
- The X and Y display for plotting captured voltage and current voltage and current data, as well as voltage waveform histograms.
- The 2-channel spectrum analyser for frequency domain display and analysis of voltage
- The Bode plotter and network analyser with built-in sweep generator.
- An impedance analyser for analysing complex RLC networks and as an RLC meter and vector
- A dc ohmmeter measures unknown resistance with respect to known external resistor or known internal 50Ω.
- Board self-calibration using the AD584 precision 2.5V reference from the ADALP2000 analogue parts kit.
- ALICE M1K voltmeter.
- ALICE M1K meter source.
- ALICE M1K desktop tool.
For more information, please look here.